Blog

Congratulations to Svitlana Vakulenko with the paper & talk at ISWC 2018!

Svitlana Vakulenko, presented a paper that she wrote together with Michael Coches, Maarten de Riijke, Axel Polleres and Vadim Savenkov at the International Semantic Web Conference 2018 held in October 2018 in  Monterey, California. Here is an excerpt from Svitlana’s blog: 

Imagine: you sit in a train, in which many different conversations are going on at the same time. A couple next to the window is planning their honey-moon trip; the girls at the table are discussing their homework; a granny is in a call with her great-grandson. You close your eyes and try to recover who is talking to whom by paying attention to the content of the conversations and not to the origin of the sound waves:

— Mhm .. and then we add the two numbers from the Pythagoras’ equation?
— … but I am not quite sure about that hotel you booked on-line… Don’t you think we should stick with the one we found on Airbnb?
—  All right, sweetheart, kiss your mum for me! I will be back before the Disney movie starts, I promise.
—  I think it is the one we did on the blackboard on Monday or was it the one with Euclidean distance?
—  For me both options are really fine as long as it is on Bali.

It is relatively easy to tell the three conversations apart. We hypothesize that this is due to certain semantic relations between utterances from the same dialogue that make it meaningful, or coherent, which brought us to the following set of questions:

  1. What are the relations between the words in a dialogue (or rather the concepts they represent) that make a dialogue semantically coherent, i.e. making sense? and
  2. Can we use available knowledge resources (e.g. a knowledge graph) to tell whether a dialogue makes sense?

The later is particularly important for dialogue systems that need to correctly interpret the dialogue context and produce meaningful responses.
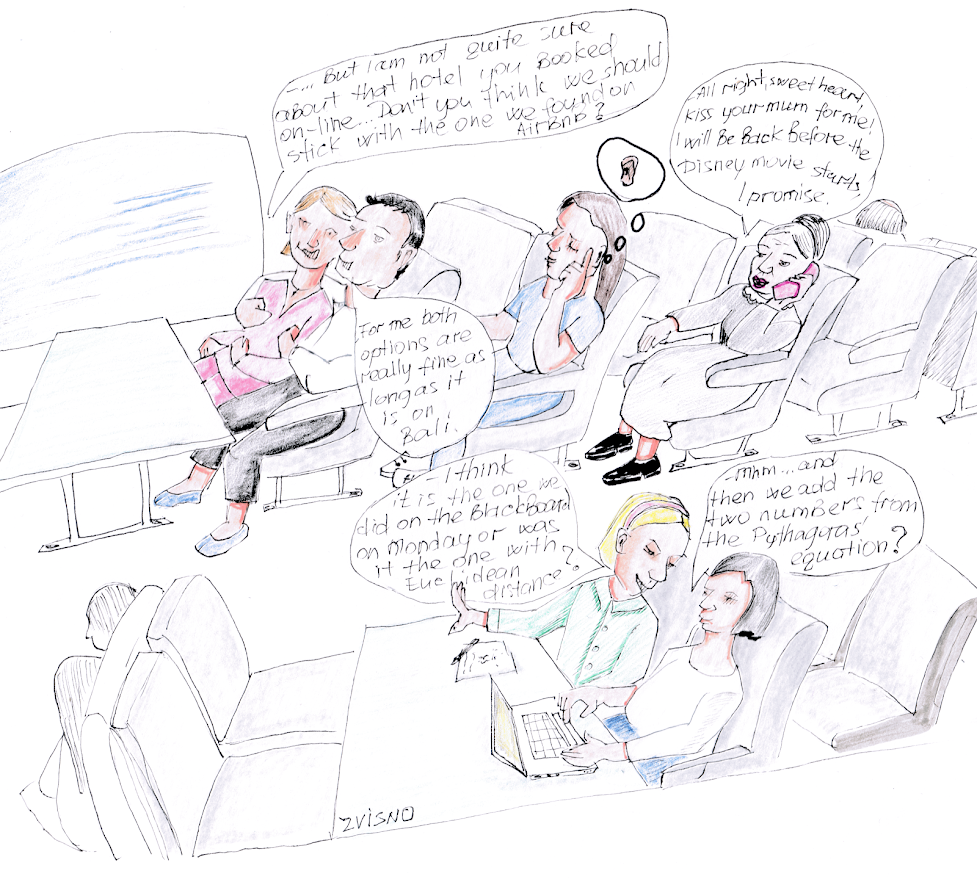
Illustration by zvisno(c)


To study these two questions we cast the semantic coherence measurement task as a classification problem. The objective is to learn to distinguish real (mostly coherent) dialogues from artificially generated dialogues, which were made incoherent by design. Intuitively, the classifier is trained to assign a higher score to the coherent dialogues and a lower score to the incoherent (corrupted) dialogues, so that the output score reflects the degree of coherence in the dialogue.

We extended the Ubuntu Dialogue Corpus, which is a large dialogue dataset containing almost 2M dialogues extracted from IRC (public chat) logs, with generated negative samples to provide an evaluation benchmark for the coherence measurement task. We came up with 5 different ways to generate negative samples, i.e. incoherent dialogues by a) sampling the vocabulary (1. uniformly at random; 2. according to the corpus-specific distribution) and b) permutations of the original dialogues (3. shuffling the sequence of entities, or combining two different dialogues via 4. horizontal and 5. vertical splits).

We also implement and evaluate three different approaches on this benchmark.
Two of them are based on a neural network classifier (Convolutional Neural Network) using word or, alternatively, Knowledge Graph embeddings; and the third approach is using the original Knowledge Graph (Wikidata+DBpedia converted to HDT) to induce a semantic subgraph representation for each of the dialogues.

Read the full story in Svitlana’s blog!

Profiles & Data:Search Workshop at TheWebConf 2018

Vadim Savenkov became a co-organizer of the International Workshop on Profiling and Searching Data on the Web,  co-located with TheWebConf’2018 (formerly known as WWW Conference) which took place in Lyon, France.

The workshop attracted four full and two short submissions on different aspects of web data management directly (see the proceedings), and included two great keynote talks by Maarten de Rijke and and Aidan Hogan followed by a panel on Data Search with Paul GrothAidan HoganJeni Tennison,Stefan Dietze and Natasha Noy.


Best Paper Award in the Societal Challenges Category at KESW 2017

The paper Ontology for Representing Human Needs  by Soheil Human, Florian Kragulj, Florian Fahrenbach and Vadim Savenkov received a Best Paper award in the category Societal Challenges at  KESW 2017, the Knowledge Engineering and Semantic Web conference, held in  November 2017 in Szczecin, Poland.

The paper describes the new ontology for representing human needs, and a need analysis experiment was conducted as part of the project pilot  Expedition Stuwerviertel (description in German) with the help of Bewextra methodology.

Position paper on Conversational Search

Svitlana Vakulenko presented the vision of conversational exploratory search, developed jointly with Ilya Markov, and Maarten de Rijke at the Search-Oriented Conversational AI 2018 Workshop, co-located with EMNLP 2018 in Amsterdam.

This is a position paper discussing the research problems and possible connections for the novel search modality combining traditional search requests with knowledge and data exploration, to be used in chatbot assistants.

The full text  Conversational exploratory search via interactive storytelling is available on arXiV.

CommuniData at STUWERTRUBEL

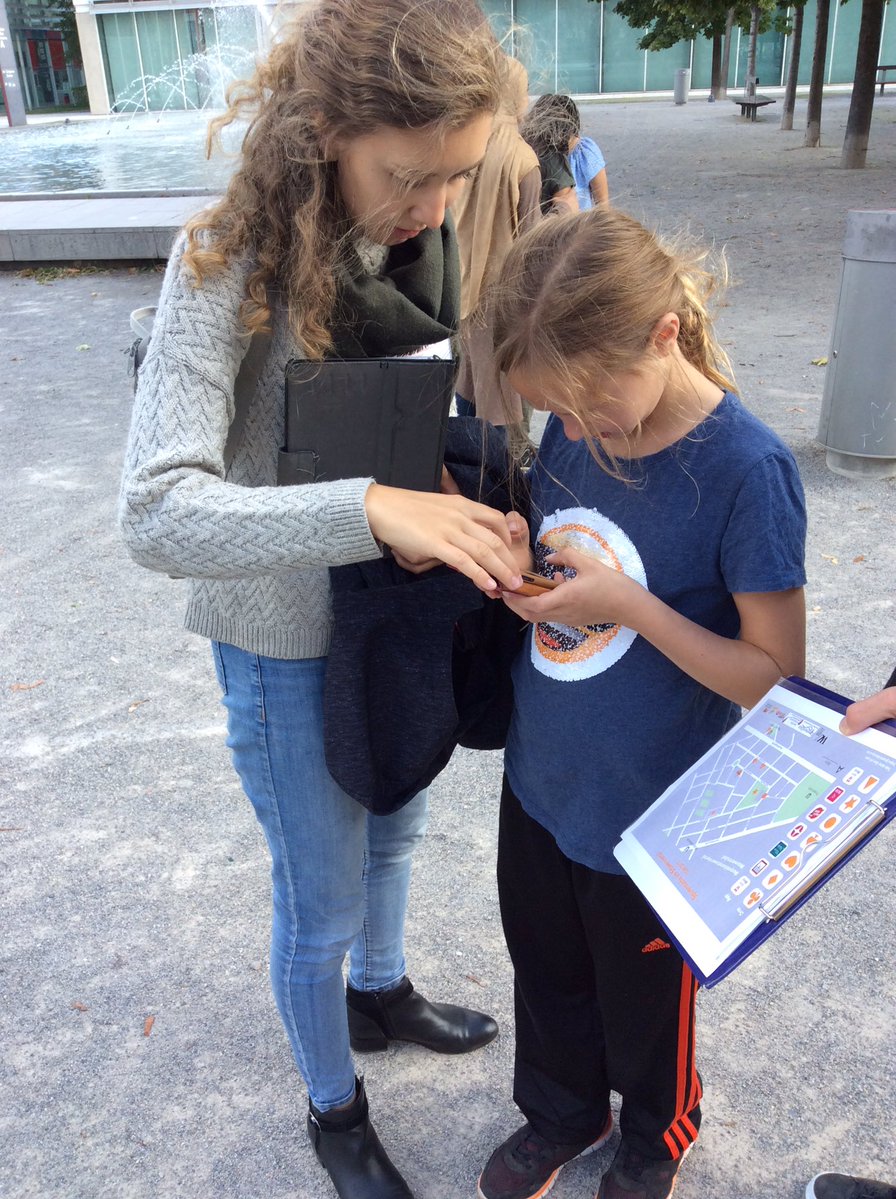
The CommuniData team took active part in the STUWERTRUBEL festival on 15th September (more details). Anna Aigner and Laura Mayr, two interns in GB* 2/20, prepared an open data quest with locations to visit across Stuwerviertel, challenges to solve and prizes to take home.

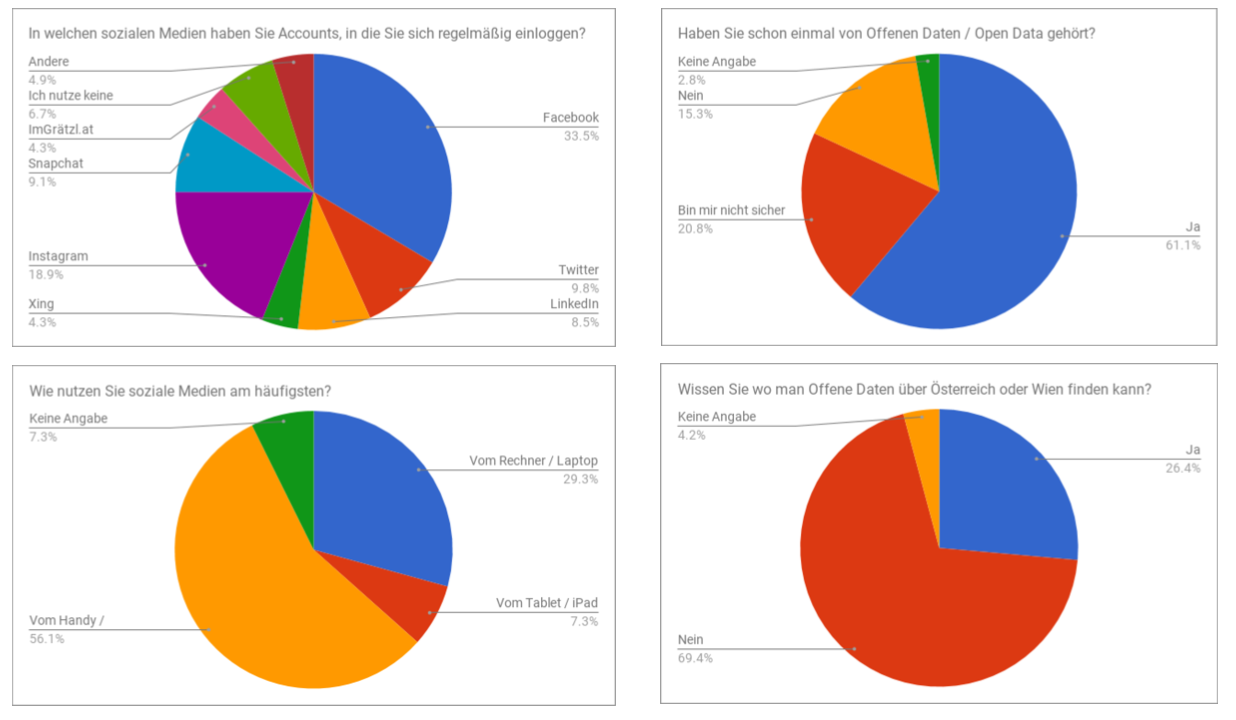
70 participants completed a survey on the use of open data and social networks. The results of the survey show that the majority of participants regularly access Facebook, Instagram and Twitter from their mobile devices, primarily cell phones. Most participants are aware of the term „open data“ but do not know, where they can actually find these data.
This is a very good reason for them to meet our Open Data Expert on Facebook, the chatbot who helps to search through the Austrian open datasets using a compact mobile phone interface.

Mobility apps by Wiener Linien, WienMobil and Quando based on the data also available as Open Data, and the mobile feedback app Sag’s Wien by the City of Vienna are the three most often used apps among the Vienna-specific ones.

Check out CommuniData project on Twitter for more impressions and photos from the event.

Austrian Open Data Day: Students Co-Create Open Data Ideas!

World Open Data Day is a global event that has the goal to promote the use of open data world-wide and develop new ideas on improving life quality and empowering local communities through the use of open data. In practice, this is the day, when many people get together to exchange their experience, experiment, have fun and develop practical applications and visualisations with open data.

Vienna University of Economics and Business in collaboration with the Linked Data Lab, TU Vienna, hosted a workshop-hackathon targeted at students, who were encouraged to develop and share their open data ideas. It was one in the Open Data Day event series organised in Vienna on March 3rd.

The focus of the workshop was on the Open Data in Austria represented by the Austria’s Open Data portals: data.gv.at and opendataportal.at. Students together with the university researchers shared their ideas, proposed innovative solutions and voted for the most exciting and promising projects to work on: fake news verification with open data, playlist suggestion to work on the open datasets, putting the local data on the map, etc.

In less than 5 hours the participants exercised in creativity, their programming and design skills and managed to already present the first prototypes of their ideas:

1. Open Data Buildings Map Visualisation

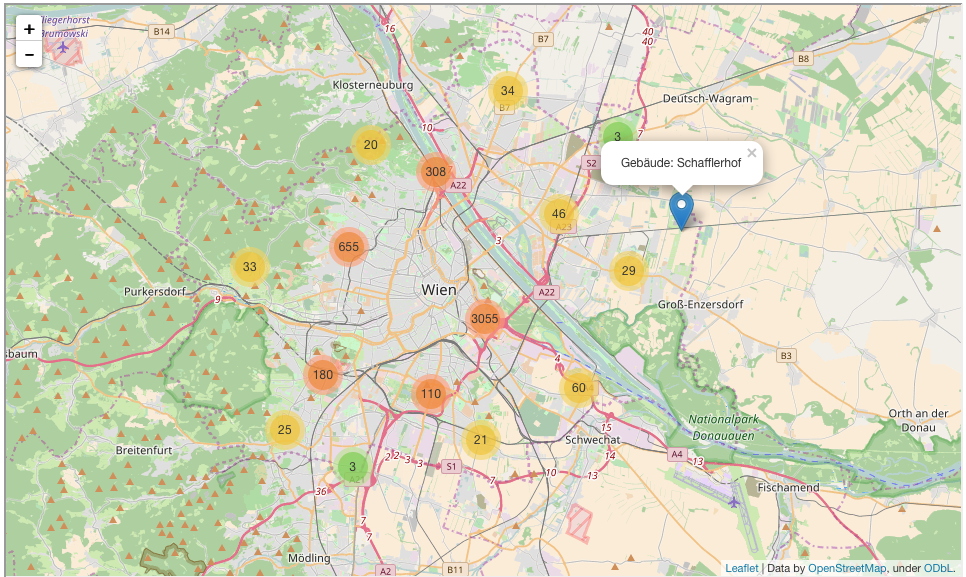
One of the student teams focused on a use case to visualise and search for „local data around you“ on a map. They implemented an open data visualisation in the Jupyter Notebook environment. The work was subdivided into aggregation and conversion of the relevant data sources, for instance, historical buildings and their addresses from the Vienna history wiki (Thanks to Bernhard Krabina from KDZ for the help!) another part of the team looked into the visualisation libraries for Python. The final Python script loads the building coordinates from a CSV file, fixes the formatting issues and marks the locations on the OpenStreetMap using folium library.

Here is how the Open Data Buildings Map of Vienna looks like:

The interactive version of this map visualisation along with the source code for its implementation is available online.

2. News Verification Browser Extension

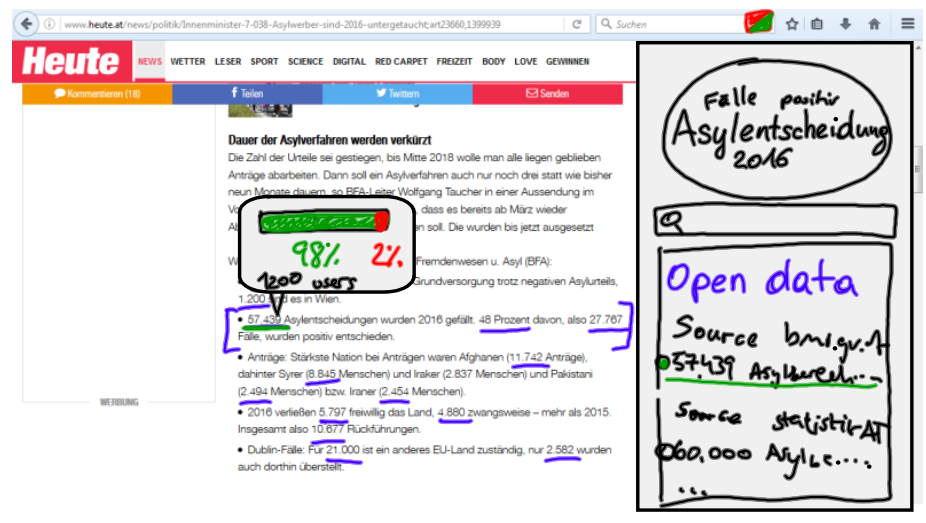
Another favourite open-data-in-use idea was the fake news verification application, the topic which is in high demand everywhere in the world right now. The students designed a mock-up sketch of a Chrome browser extension that will provide the means to crowd-source online news annotations and also contrast the figures provided in the news articles with the analogous figures available from the open data sources. It is indeed a highly ambitious and relevant project idea that contains several research questions on how to enable the correct alignment between the news text and tabular data.

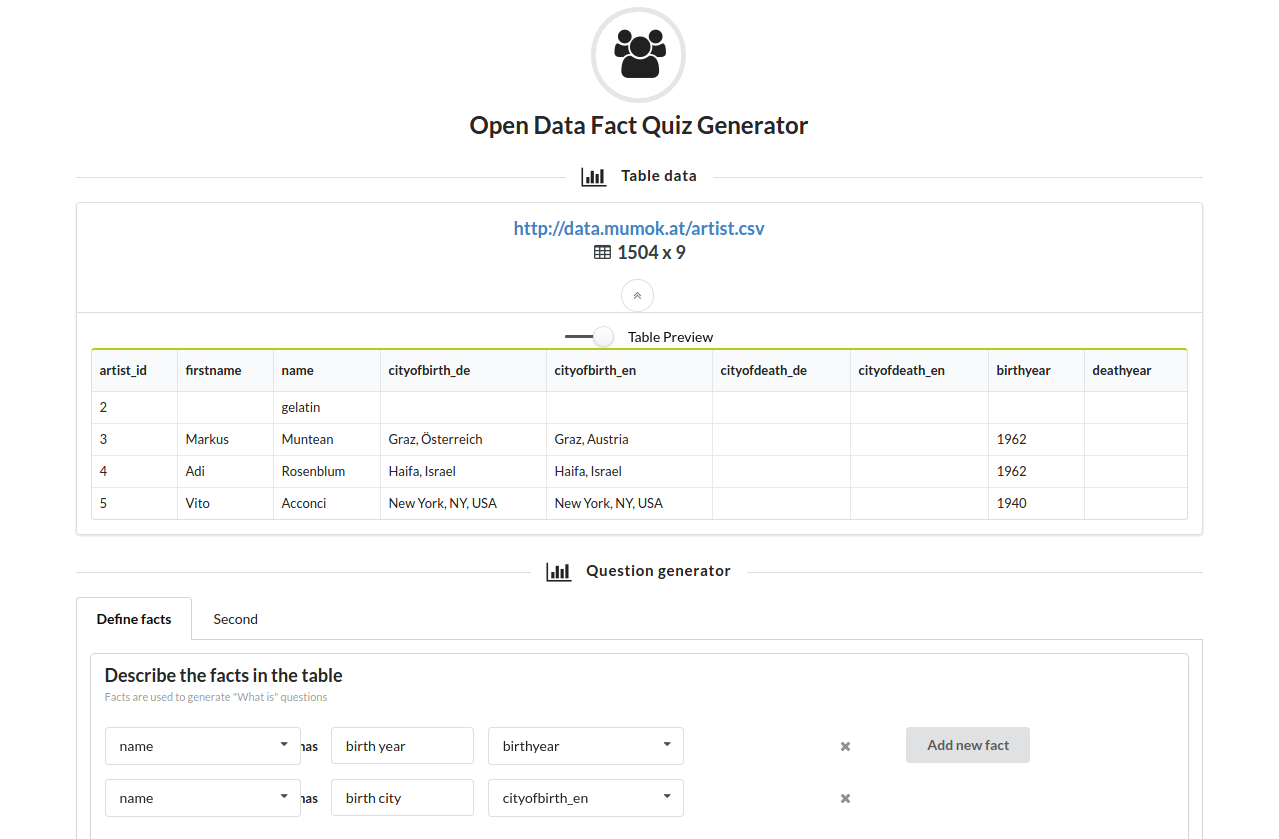
3. Open Data Fact Quiz Generator

The third team further developed the idea of adding the gamification element to the process of exploring and enriching existing open datasets. They took up a challenge of implementing the first prototype of the game with a purpose that would generate quiz questions from the open data tables to enable and bootstrap their annotation. The users would play the game by interacting with the datasets to test and expand their knowledge, and, at the same time, contribute to the community by verifying and improving the quality of open data.

Big thanks to the organisers and participants of the workshop for the great event!

More info about the Open Data Day ’17 in Vienna:
1. opendataday.org
2. open.wien.gv.at/site/open-data-day-2017-veranstaltungen-in-wien
3. digitalcity.wien/offene-daten-begreifen-open-data-day-2017

Dogs in Vienna. Part 3: Open Data Dashboard Tutorial

This is a sample script showing how open data can be analysed and demonstrated using Jupyter Notebooks and Declarative Widgets. We take the dog statistics data in Vienna as a sample use case to demonstrate common approaches to analyse open data. The final dashboard and an interactive development environment (IDE) with all the tutorial notebooks are available from our temporal Jupyter Notebook Server.

Open Data Story

It is useful to define a set of possible research questions that define the goal of the data study and refine them along the way since the availablity of data suggests possible ways to combine and explore it.

Research Questions

  1. Which Vienna districts are most fond of Wiener dogs?
  2. How many Wiener dogs are there in my district?

This time we do not only find answers to our questions, but also create a web dashboard with interactive visualization to share our findings with others.

Get the Data

We described how to load and preprocess the dataset in the previous post. It is often not that trivial as it may seem and involves a lot of data wrangling and debugging in order to find and eliminate possible errors or inconsistences in the dataset.

This step should not be underestimated since it defines the final result of our data analysis.
Remember: „Garbage in, garbage out!“

In [198]:
# Load libraries
import pandas as pd # CSV file processing
import numpy as np # vector and matrix manipulation

# Load the csv file from the open data portal
# dataset description: https://www.data.gv.at/katalog/dataset/stadt-wien_anzahlderhundeprobezirkderstadtwien/resource/b8d97349-c993-486d-b273-362e0524f98c
data_path = 'https://www.wien.gv.at/finanzen/ogd/hunde-wien.csv'
# Look up the row file and specify the dataset format, e.g. delimiters
data = pd.read_csv(data_path, delimiter=';', skiprows=1, thousands=',', encoding='latin-1')

# Correct individual values in the dataset
data.loc[1914, 'Anzahl'] = 1510
data.loc[5347, 'Anzahl'] = 2460

# Carefully select the string separator, including spaces!
separate_breeds = data['Dog Breed'].str.split(' / ', expand=True)
separate_breeds.columns = ["Breed_1", "Breed_2"]
data = pd.concat([data, separate_breeds], axis=1)

# Correct encoding for special characters in german alphabet
def to_utf(x):
    return x.encode('latin-1').decode('utf8') if isinstance(x, str) else x   
data = data.applymap(to_utf)

# Aggregate
data = data.groupby(['DISTRICT_CODE', 'Breed_1'])['Anzahl'].aggregate(np.sum).reset_index()
data.columns = ["District", "Dog_Breed", "Dog_Count"]

# Check the top of the table to make sure the dataset is loaded correctly 
data.head()
Out[198]:
District Dog_Breed Dog_Count
0 90100 Afghanischer Windhund 1
1 90100 Amerikanischer Pit-Bullterrier 1
2 90100 Amerikanischer Staffordshire-Terrier 5
3 90100 Australian Shepherd Dog 3
4 90100 Australian Terrier 1

Show the Data

Interactive Table

In [199]:
# Load library for the interactive visualizations
import declarativewidgets
declarativewidgets.init()

Import widgets

In [200]:
%%html
<link rel="import" href="urth_components/urth-viz-table/urth-viz-table.html" is='urth-core-import'>
<link rel="import" href="urth_components/paper-input/paper-input.html" is='urth-core-import' package='PolymerElements/paper-input'>

Write functions to load and process data in the table

In [202]:
# Match pattern
def filter_by_pattern(df, pattern):
    """Filter a DataFrame so that it only includes rows where the Dog Breed
    column contains pattern, case-insensitive.
    """
    return df[df['Dog_Breed'].str.contains(pattern, case=False)]

# Load data
def dogs_table(pattern=''):
    """Build a DataFrame.   
    """
    # Use match pattern
    df = data.pipe(filter_by_pattern, pattern)     
    return df
In [218]:
%%html
<template is="urth-core-bind">
    <paper-input value="{{pattern}}" label="Filter by dog breed" ></paper-input>
</template>

<template is="urth-core-bind">

    <urth-core-function ref="dogs_table"  
                        arg-pattern="{{pattern}}" 
                        result="{{dogs_table}}" 
                        limit="1600 "
                        delay="500" 
                        auto>
    </urth-core-function>
    
    <urth-viz-table datarows="{{ dogs_table.data }}" 
                    rows-visible="5" 
                    selection="{{dog_selection}}" 
                    columns="{{ dogs_table.columns }}" 
                    selection-as-object>
    </urth-viz-table>
    
</template>

Interactive Bar Chart

In [204]:
# Create Multi-index
district_stats = data.set_index(['District', 'Dog_Breed'])
# Calculate percentages
breed_percents = (district_stats.div(district_stats.sum(axis=0, level=0), level=0) * 100).round(1).reset_index()
# Rename column
breed_percents = breed_percents.rename(columns = {'Dog_Count':'Dog_Percent'})
# Preview
breed_percents.head()
Out[204]:
District Dog_Breed Dog_Percent
0 90100 Afghanischer Windhund 0.2
1 90100 Amerikanischer Pit-Bullterrier 0.2
2 90100 Amerikanischer Staffordshire-Terrier 1.1
3 90100 Australian Shepherd Dog 0.6
4 90100 Australian Terrier 0.2
In [206]:
breed = 'Dackel'
# Filter
breed_districts = breed_percents[(breed_percents['Dog_Breed'] == breed)]
# Remove column
breed_districts = breed_districts.drop('Dog_Breed', axis=1)
# Sort
breed_districts = breed_districts.sort_values(ascending=False, by='Dog_Percent')
# Rename column
breed_districts = breed_districts.rename(columns = {'Dog_Percent':'Percent_of_' + breed})
breed_districts.head()
Out[206]:
District Percent_of_Dackel
454 90400 3.6
1971 91500 3.3
777 90700 3.2
2266 91700 3.2
573 90500 3.1

Create function to load percents per district given the breed

In [215]:
# Filter data
def dogs_bar_chart(breed='Dackel'):
    """Build a DataFrame.   
    """
    # Filter
    df = breed_percents[(breed_percents['Dog_Breed'] == breed)]
    # Use match pattern
#     df = breed_percents.pipe(filter_by_pattern, breed)
    # Remove column
    df = df.drop('Dog_Breed', axis=1)
    # Sort
    df = df.sort_values(ascending=False, by='Dog_Percent')
    # Rename column
    df = df.rename(columns = {'Dog_Percent':'Percent_of_' + breed})  
    return df

Import bar chart widget

In [216]:
%%html
<link rel="import" href="urth_components/urth-viz-bar/urth-viz-bar.html" is='urth-core-import'>
In [217]:
%%html
<template is="urth-core-bind">
    <urth-core-function ref="dogs_bar_chart"  
                        arg-breed="{{dog_selection.Dog_Breed}}" 
                        result="{{df}}" 
                        limit="1600 "
                        delay="500" 
                        auto>
    </urth-core-function>
    <urth-viz-bar xlabel="Districts" ylabel="% to the total number of dogs in the district" datarows="{{df.data}}" columns="{{df.columns}}"></urth-viz-bar>
</template>

Lessons Learned

Dogs in Vienna

Based on the data available we were able to provide comprehensive answers to the set of research questions proposed in the introduction.

  1. The true fans of Wiener dogs live in the 4th district of Vienna.
  2. Wiener dogs are underreprestented in Leoplodstadt (2nd district). They constitute only 2% of the dog population.

Steps

1. Find datasets, e.g. CSV files from open data portals
2. Refine: identify column separator, thousands separator, rows to skip, string encoding, etc.
3. Aggregate: group by different attributes, e.g. district or type, and sum up the counts.
+ 4. Show the row data table for the user to be able to interact with the data.
5. Calculate proportions to the total sum in the group.
6. Slice: filter out rows, e.g. by district or type.
+ 7. Show sorted stats as a bar chart.

Prerequisites

To run this script on a local machine you need:

  • Python 3.4.
  • pandas
  • numpy
  • jupyter_declarativewidgets

Inspired by

  1. Health Inspections Dashboard
  2. tmpnb: deploy temporal Jupyter Notebook server
  3. Wheelan, Charles J. Naked Statistics. 2013